
Help
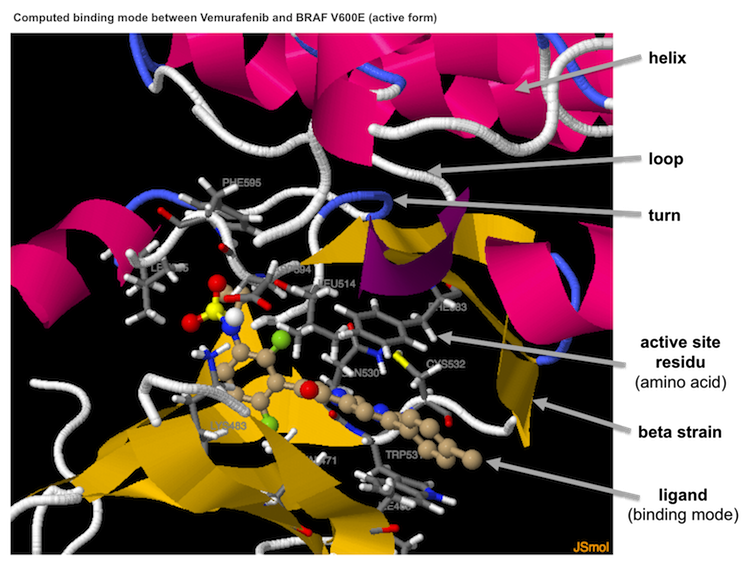
cking results A 3D session presents the predicted binding mode of the ligand to the protein on a new page (on a new tab on tested browsers). You can interact with this 3D session by using your mouse or a trackpad. As an illustration, you can rotate the image with button 1 or zoom it with button 2 (a pop-up menu, of little use in our case, appears when you right click).A coloured ribbon represents the secondary structure of the protein: helices in magenta, beta sheets in yellow, coils in blue and loops in grey. The protein residues involved in ligand binding are represented as sticks that ar e coloured according to the atoms (carbon in grey). The names of the amino acids are indicated. Sticks and balls represent the ligand; their colours depend on the nature of the atoms (carbon atoms are a brownish-beige).
A scale of scores is shown below; i.e. a quantification of the ligand's binding to the protein. The higher the score (green on the scale) the stronger the binding and, as a result, the molecule will be active on its target (either therapeutic or toxic). In contrast, a weak binding - which usually means a bad ligand for this particular protein - will have a weak score (red on the scale). The pre-calculated scores for the exi sting molecules are indicated with arrows above the scale, whereas the score that results from the docking of a new molecule are indicated below the scale.
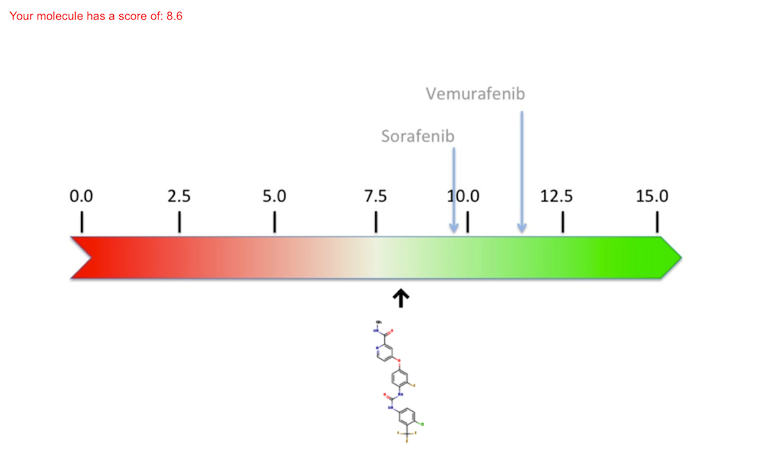
This allows you to compare the quality of the predicted binding of your "virtual" molecule with "real" drugs.